Visualization Strike Center
Monitor accurate lightning strikes event. Our high-fidelity interface translates raw atmospheric data into actionable intelligence.
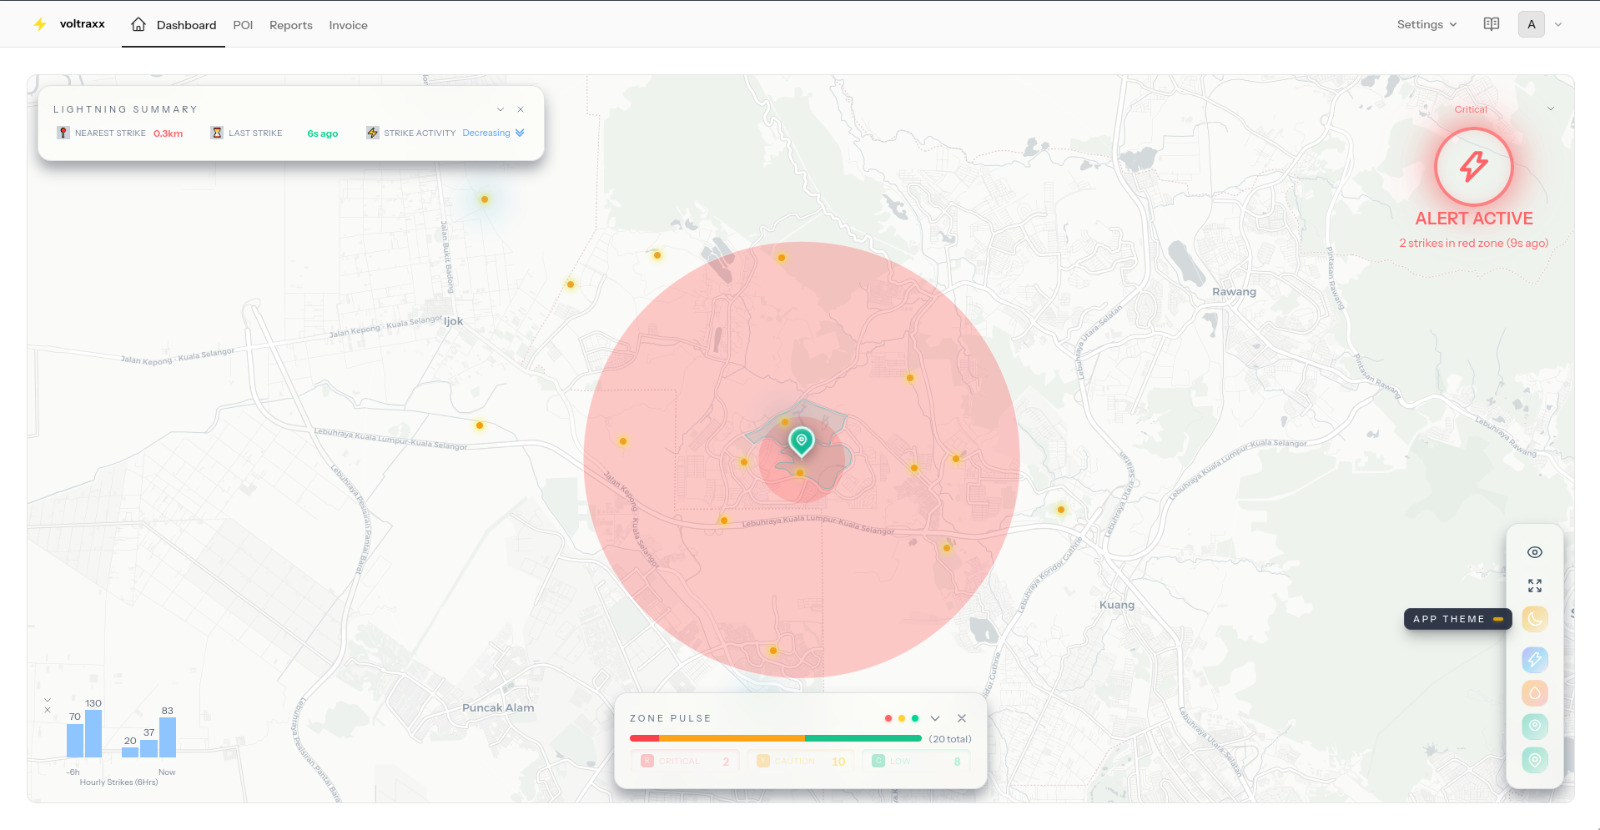
01. POI, Lightning Map & Zone Pulse
Key Lightning Data Points
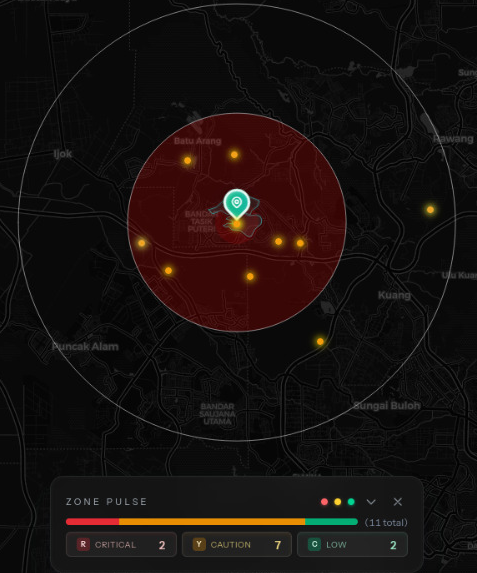
Zone Pulse Intelligence
The LIGHTNING MAP visually tracks strike distribution relative to your POI. The configurable ZONE PULSE provides precise strike counts.
Where exactly are the most dangerous strikes located?
02. Lightning Summary
Key Lightning Data Points
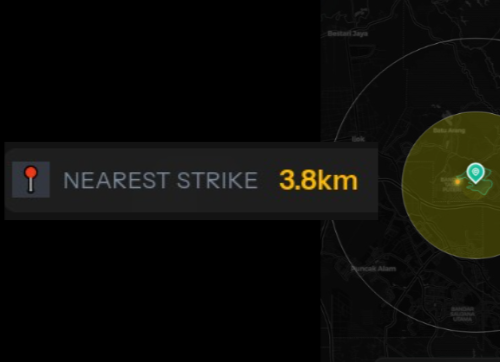
Distance of Nearest Strike
Determine proximity and safety status instantly. The NEAREST STRIKE indicator shows real-time distance to your POI.
Is the lightning close enough to trigger safety protocols?
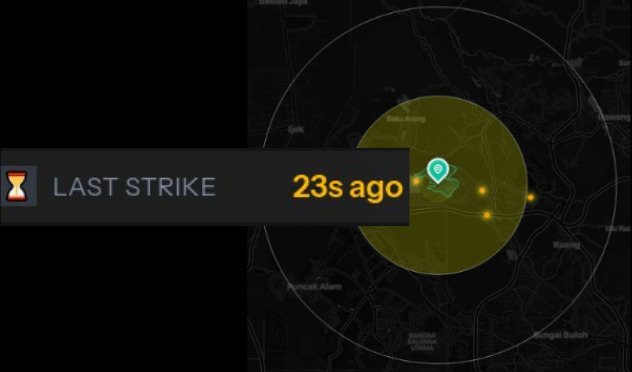
Time of Last Strike
Confirm active and immediate threat. The LAST STRIKE provides evidence of the most recent event.
When was the last strike of lightning happened?
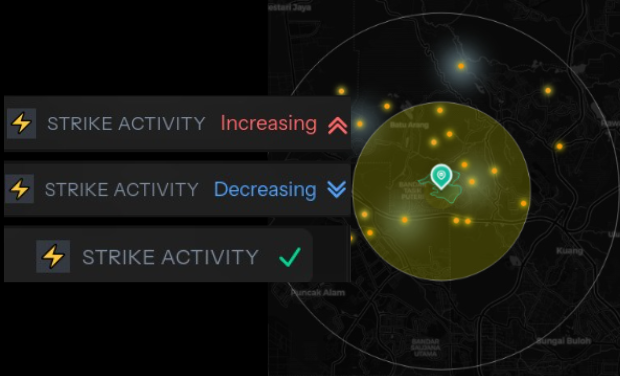
Strike Activity Trend
Analyze intensity and frequency. STRIKE ACTIVITY tells you if danger is escalating or subsiding.
Is the lightning threat increasing or decreasing?
03. Continuous Sphere Tracker
Threat Movement Analysis
Post-Crisis Tracking
After acknowledgment, the SPHERE TRACKER remains active to provide continuous monitoring. It highlights risk transitions from Critical to Caution/Low and eventually All Clear.
How do I track the movement of the threat level?
04. Recent History
Storm Intensity Trends
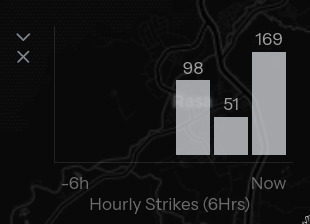
Hourly Intensity Overview
The HOURLY STRIKES provides overview of intensity over 6 hours. It acts as an analytical tool to justify suspension or resumption.
Did lightning activity intensify or diminish recently?